Monitoring
Bloodraven exposes Prometheus metrics, a REST status API, and a WebSocket endpoint for real-time status streaming. For the structured-log field set and the stable msg vocabulary that downstream log pipelines key off of, see the Log schema contract.
:::tip Setup guides Use Prometheus Setup and Grafana Dashboards for installation. This page is the complete observability reference. :::
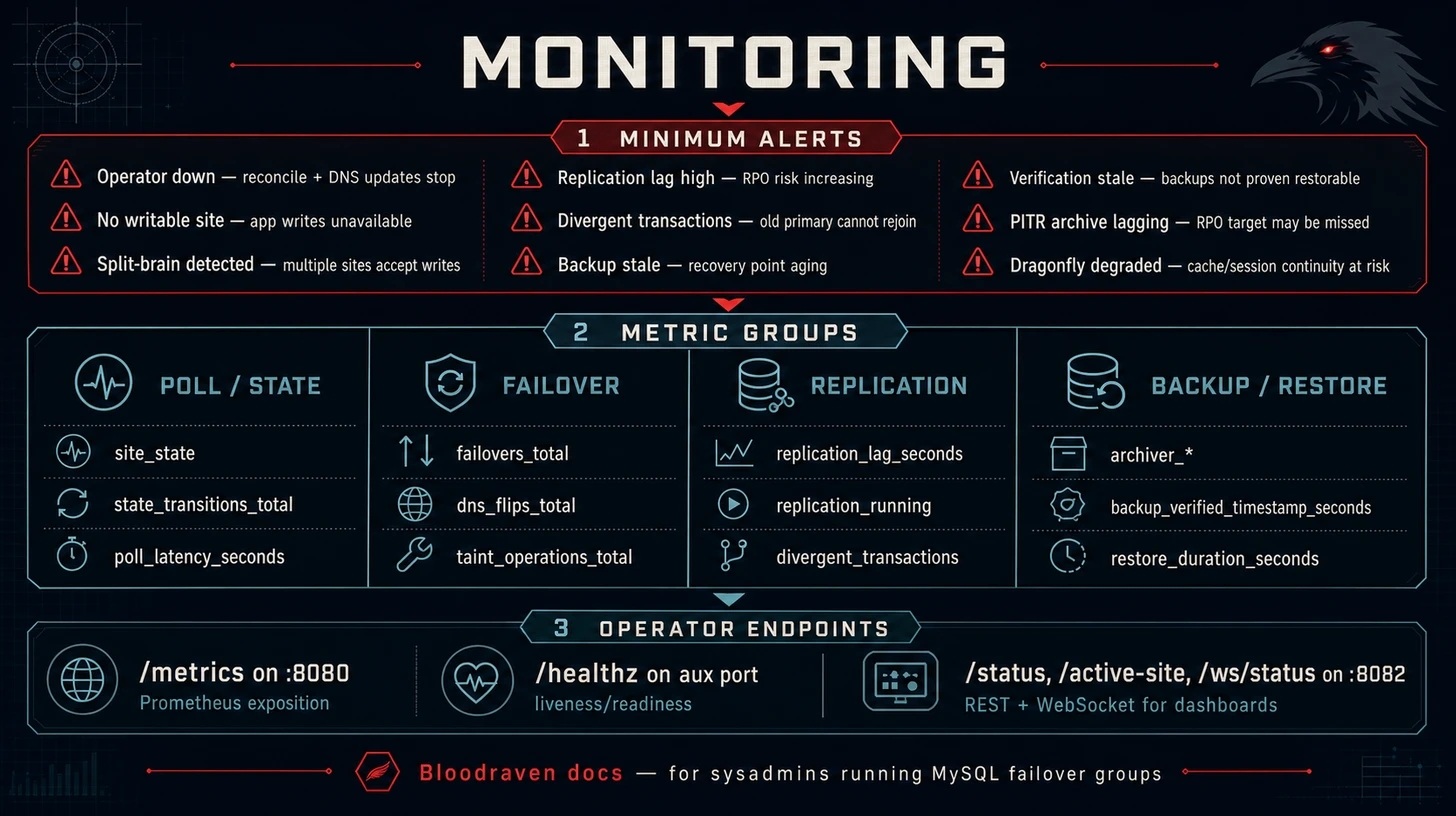
Minimum alert set
| Signal | Why it matters | Runbook |
|---|---|---|
| Operator down | Reconciliation and DNS updates stop | Operator unavailable |
| No writable site | Application writes are unavailable | Emergency manual promotion |
| Split-brain detected | More than one site may accept writes | Split-brain recovery |
| Replication lag high | RPO risk is increasing | Replication lag high |
| Divergent transactions | Old primary cannot safely rejoin | Divergent recovery |
| Backup stale | Recovery point is aging | Failed backup |
| Verification stale | Backups are not proven restorable | Backup Verification |
| PITR archive lagging | PITR RPO target may be missed | Backup And Restore |
| Dragonfly degraded | Cache/session continuity may be unavailable during planned failover | Playground Dragonfly co-management |
Operator health
Check these before debugging individual failover groups:
kubectl rollout status deployment/bloodraven -n bloodraven
kubectl logs -n bloodraven deploy/bloodraven
kubectl port-forward -n bloodraven deploy/bloodraven 8080:8080
curl http://localhost:8080/metrics | grep '^bloodraven_'
Prometheus metrics
Metrics are served on :8080/metrics in standard Prometheus exposition format.
Available metrics
| Metric | Type | Labels | Description |
|---|---|---|---|
bloodraven_poll_latency_seconds | Histogram | site | Duration of each MySQL poll |
bloodraven_state_transitions_total | Counter | site, from, to | Count of state transitions per site |
bloodraven_taint_operations_total | Counter | site, action | Count of node taint/untaint operations |
bloodraven_dns_flips_total | Counter | site | Count of DNSEndpoint updates (DNS record flips) |
bloodraven_failovers_total | Counter | target_site | Total number of failovers executed. Incremented after successful MySQL promotion. |
bloodraven_primary_reassert_total | Counter | site | Times the operator restored writability on the promoted primary after finding it fenced with no writable site remaining (typically the target's own sidecar re-fenced it with a stale lease right after a promotion). A steadily increasing counter means something keeps fencing the primary — check the sidecars' connectivity to the operator's auxiliary Service. |
bloodraven_websocket_connected_clients | Gauge | -- | Number of currently connected WebSocket clients |
bloodraven_replication_lag_seconds | Gauge | site | Replication lag in seconds on the replica site. -1 if lag is NULL (not replicating). Only present for replica sites. |
bloodraven_replication_running | Gauge | site, thread | Whether a replication thread is running (1=yes, 0=no). Thread is io or sql. Only present for replica sites. |
bloodraven_replication_source_state | Gauge | namespace, group, site, state | Direct-source convergence state set for each follower, scoped by failover group. state is one of converged, pending, or blocked; one series is 1 and the others are 0. Cleared for the active primary. |
bloodraven_site_state | Gauge | site, state | Current site state as a state-set: 1 for the current state, 0 for others. State is writable, read-only, unreachable, or unknown. |
bloodraven_divergent_transactions | Gauge | site | Number of divergent transactions on a site pending recovery after emergency failover. 0 when healthy. Non-zero means the site has committed transactions that never replicated to the current primary. |
bloodraven_archiver_upload_failures | Gauge | namespace, group, site | Cumulative PITR archiver upload failures reported by the per-site sidecar. Monotonic except across sidecar restarts — use increase() / rate() in dashboards. |
bloodraven_archiver_last_upload_timestamp_seconds | Gauge | namespace, group, site | Unix timestamp of the last successful PITR binlog archive per site. 0 if nothing archived yet. |
bloodraven_archiver_backlog_files | Gauge | namespace, group, site | Sealed binlogs present in the MySQL index but missing from the archiver manifest at the end of the last scan. >0 means archival is falling behind. |
bloodraven_backup_verified_timestamp_seconds | Gauge | group, profile | Unix timestamp of the last Succeeded MysqlBackupVerification per profile. Anchor staleness alerts on this gauge — a fresh bloodraven_backup_last_success_timestamp_seconds without a fresh verification means nobody has proven the backup can be restored. |
bloodraven_backup_verification_last_attempt_timestamp_seconds | Gauge | group, profile | Unix timestamp of the last terminal verification attempt, regardless of result. Distinguishes "verification never ran" from "verification ran but failed". |
bloodraven_backup_verification_runs_total | Counter | group, profile, result | Terminal verification attempts labelled success or failure. |
bloodraven_backup_verification_duration_seconds | Histogram | group, profile | Wall-clock duration of a verification run. |
bloodraven_backup_verification_replay_lag_seconds | Gauge | group, profile | For verifications with PITR replay enabled: completionTime − replayedThroughBinlog.timestamp. A rising value means archived binlogs trail the live primary — alert below your RPO target. |
bloodraven_restore_duration_seconds | Histogram | namespace, group, restore_kind, target_site | Data-plane duration of successful restore Jobs. restore_kind is init_from_backup or in_place; duration starts at Job status.startTime when available and ends when the operator observes terminal success. |
bloodraven_restore_last_success_timestamp_seconds | Gauge | namespace, group, restore_kind, target_site | Unix timestamp of the last successful restore Job observation. |
bloodraven_restore_last_source_size_bytes | Gauge | namespace, group, restore_kind, target_site | Source backup artifact size in bytes for the most recent successful restore when known from MysqlBackup.status.sizeBytes. Direct S3/PVC restores and unknown sizes clear/omit this series so an older known size is not reported as current. |
bloodraven_dragonfly_site_up | Gauge | group, site | Dragonfly site reachability from the operator's latest INFO replication poll (1 reachable, 0 unreachable). |
bloodraven_dragonfly_promotions_total | Counter | group, target_site, result | Dragonfly promotion attempts labelled success, failed, or skipped. Failed promotions mean sessions/cache may have been discarded even if MySQL failover succeeded. |
bloodraven_dragonfly_manager_panics_total | Counter | namespace, name | Panics recovered inside the Dragonfly manager polling loop. Any increase should be investigated. |
Dragonfly replica full-resync state is exposed on the CR as
status.dragonfly.sites[].syncInProgress, with companion fields
linkStatus, lastIOSecondsAgo, and ready. If you export custom-resource
status with kube-state-metrics or another CRD status adapter, alert when
syncInProgress remains true for longer than the expected warm-up window or
when it toggles repeatedly outside planned failovers and Dragonfly image
rollouts. Frequent full resyncs can spike master latency and reduce planned
failover session-preservation confidence.
Scrape configuration
Add a scrape job for the operator:
# prometheus.yml
scrape_configs:
  - job_name: bloodraven
    kubernetes_sd_configs:
      - role: pod
        namespaces:
          names: [bloodraven]
    relabel_configs:
      - source_labels: [__meta_kubernetes_pod_label_app_kubernetes_io_name]
        regex: bloodraven
        action: keep
      - source_labels: [__meta_kubernetes_pod_container_port_number]
        regex: "8080"
        action: keep
Or if using the Prometheus Operator, create a PodMonitor:
apiVersion: monitoring.coreos.com/v1
kind: PodMonitor
metadata:
  name: bloodraven
  namespace: bloodraven
spec:
  selector:
    matchLabels:
      app.kubernetes.io/name: bloodraven
  podMetricsEndpoints:
    - port: metrics
      interval: 15s
Alerting rules
Recommended alerts:
groups:
  - name: bloodraven
    rules:
      # Site has no healthy primary
      - alert: BloodravenNoPrimary
        expr: |
          count by (site) (
            bloodraven_state_transitions_total{to="writable"}
          ) == 0
        for: 5m
        labels:
          severity: critical
        annotations:
          summary: "Site {{ $labels.site }} has no writable primary"

      # High poll latency may indicate network issues
      - alert: BloodravenHighPollLatency
        expr: |
          histogram_quantile(0.99, rate(bloodraven_poll_latency_seconds_bucket[5m])) > 1
        for: 5m
        labels:
          severity: warning
        annotations:
          summary: "Poll latency to {{ $labels.site }} exceeds 1 second (p99)"

      # Failover occurred
      - alert: BloodravenFailoverOccurred
        expr: increase(bloodraven_failovers_total[5m]) > 0
        labels:
          severity: warning
        annotations:
          summary: "Failover occurred: {{ $labels.target_site }} promoted as new primary"

      # Replication lag exceeds threshold
      - alert: BloodravenReplicationLagging
        expr: bloodraven_replication_lag_seconds > 300
        for: 2m
        labels:
          severity: warning
        annotations:
          summary: "Replication lag on {{ $labels.site }} is {{ $value }}s"

      # Divergent transactions after emergency failover
      - alert: BloodravenDivergentTransactions
        expr: bloodraven_divergent_transactions > 0
        labels:
          severity: critical
        annotations:
          summary: "{{ $labels.site }} has {{ $value }} divergent transactions — trigger reclone to recover"

      # Replication thread down
      - alert: BloodravenReplicationDown
        expr: bloodraven_replication_running == 0
        for: 1m
        labels:
          severity: critical
        annotations:
          summary: "Replication {{ $labels.thread }} thread stopped on {{ $labels.site }}"

      # No writable site
      - alert: BloodravenNoWritableSite
        expr: |
          max(bloodraven_site_state{state="writable"}) == 0
        for: 30s
        labels:
          severity: critical
        annotations:
          summary: "No site is currently writable"

      # Dragonfly site unavailable; MySQL remains authoritative, but planned
      # session/cache continuity is at risk.
      - alert: BloodravenDragonflySiteDown
        expr: bloodraven_dragonfly_site_up == 0
        for: 2m
        labels:
          severity: warning
        annotations:
          summary: "Dragonfly site {{ $labels.site }} is unreachable for {{ $labels.group }}"

      # Failed Dragonfly promotion means the MySQL failover may have succeeded
      # with sessions/cache discarded.
      - alert: BloodravenDragonflyPromotionFailed
        expr: increase(bloodraven_dragonfly_promotions_total{result="failed"}[5m]) > 0
        labels:
          severity: warning
        annotations:
          summary: "Dragonfly promotion failed for {{ $labels.group }} target {{ $labels.target_site }}"

      # A recovered panic keeps the manager alive, but it is still a bug signal.
      - alert: BloodravenDragonflyManagerPanic
        expr: increase(bloodraven_dragonfly_manager_panics_total[5m]) > 0
        labels:
          severity: critical
        annotations:
          summary: "Dragonfly manager recovered a panic for {{ $labels.namespace }}/{{ $labels.name }}"
Grafana dashboards
Bloodraven ships five ready-to-use Grafana dashboards covering every metric the operator publishes. They live in the chart at charts/bloodraven/dashboards/ and are also installable as ConfigMaps via the Helm chart.
| Dashboard | UID | What it's for |
|---|---|---|
| Overview | bloodraven-overview | Health at a glance: writable sites, state timeline, failover activity, replication lag, backup/archiver freshness. Start here. |
| Failover & Topology | bloodraven-failover | Auto and planned failovers, durations, lag-wait histograms, state transitions, DNS flips, node taints, split-brain resolves. |
| Replication & Recovery | bloodraven-replication | Replication lag per site, IO/SQL thread up/down, divergent transactions, reclone ops, poll latency. |
| Backups & Verification | bloodraven-backups | Backup run/failure counts, duration, size, last-success age, verification runs, PITR replay lag. |
| PITR Archiver | bloodraven-archiver | Per-site archiver upload age, backlog files, upload failures. |
All five dashboards share a datasource variable and cross-link in the top-left corner, so you can roam between them without losing the time range.
Setup — three paths
Pick whichever matches your Grafana install. All three use the same JSON files.
1. Helm chart + kube-prometheus-stack (zero-config)
If your Grafana is deployed by kube-prometheus-stack or the upstream grafana/grafana chart, its dashboard-sidecar watches for ConfigMaps labelled grafana_dashboard: "1" by default. Just enable the flag:
helm upgrade --install bloodraven bloodraven/bloodraven \
  --namespace bloodraven --create-namespace \
  --set grafanaDashboards.enabled=true
The chart renders one ConfigMap per dashboard, the sidecar picks them up within ~30s, and the dashboards appear in a "Bloodraven" folder in Grafana. No restart, no re-login.
Common tweaks in values.yaml:
grafanaDashboards:
  enabled: true
  # Sidecar is often scoped to the monitoring namespace
  namespace: monitoring
  # Change folder name
  folder: MySQL / Bloodraven
  # If your sidecar watches a non-default label
  label: grafana_dashboard
  labelValue: "1"
2. Grafana file-based provisioning
If you provision Grafana from disk, copy the JSON files into your provisioning directory and point a provider at them:
# One-time copy (re-run on upgrade to get dashboard updates)
kubectl -n monitoring cp -c grafana \
  bloodraven/charts/bloodraven/dashboards \
  grafana-pod:/var/lib/grafana/dashboards/bloodraven
# /etc/grafana/provisioning/dashboards/bloodraven.yaml
apiVersion: 1
providers:
  - name: bloodraven
    folder: Bloodraven
    type: file
    disableDeletion: false
    updateIntervalSeconds: 30
    allowUiUpdates: true
    options:
      path: /var/lib/grafana/dashboards/bloodraven
3. Manual UI import
For one-off installs:
- In Grafana, click Dashboards → New → Import.
- Paste the contents of any file in
charts/bloodraven/dashboards/. - Pick your Prometheus datasource when prompted.
- Repeat for each dashboard you want.
Cross-dashboard links use the dashboard UID (bloodraven-overview, etc.) so they keep working as long as you don't edit the UID on import.
Prerequisites
- Your Prometheus must be scraping the operator — either the ServiceMonitor the chart ships (
--set metrics.serviceMonitor.enabled=true) or an equivalent scrape job. - The dashboards use standard Prometheus histograms/gauges, so no recording rules are required. Alerts in the next section can sit alongside them.
Kubernetes Events
Bloodraven emits standard Kubernetes Events on MysqlFailoverGroup and MysqlBackup resources. These events can be forwarded to Slack, PagerDuty, or any webhook endpoint using tools like Kubewatch, Argo Events, or Event Router.
Topology and failover
| Reason | Type | Description |
|---|---|---|
FailoverExecuted | Normal | A failover completed and a new primary was promoted |
DataLossDetected | Warning | Divergent transactions found on old primary after emergency failover |
RecoveryComplete | Normal | Old primary recovered and is now replicating |
RecloneRequested | Normal | Admin submitted a valid bloodraven.shipstream.io/reclone-site annotation; CLONE INSTANCE will start on the next poll |
RecloneRejected | Warning | Reclone annotation failed the safety interlock (unknown site, missing/short/mismatched divergent-GTID prefix); annotation was cleared so the admin can retry |
SplitBrainDetected | Warning | Both sites are writable (split brain) |
NoPrimaryDetected | Warning | Both sites are read-only (no primary) |
TotalLossDetected | Warning | Both sites are unreachable |
SiteRecovered | Normal | Degraded condition cleared, topology is healthy |
Backup lifecycle
| Reason | Type | Description |
|---|---|---|
BackupStarted | Normal | Backup Job created |
BackupSucceeded | Normal | Backup completed successfully |
BackupFailed | Warning | Backup Job failed |
InFlightFailover | Warning | Active site changed while a backup was in progress |
Backup scheduling
| Reason | Type | Description |
|---|---|---|
BackupScheduleInvalid | Warning | Schedule references an unknown backup profile |
BackupScheduleServiceAccountMissing | Warning | Operator ServiceAccount not configured |
BackupRetryScheduled | Normal | Retry scheduled for a failed backup |
BackupPITRNotImplemented | Warning | spec.backup.pitr field has no effect (reserved for future use) |
Artifact cleanup
| Reason | Type | Description |
|---|---|---|
ArtifactCleanupStarted | Normal | Cleanup Job created for backup artifact |
ArtifactCleanupSucceeded | Normal | Artifact removed successfully |
ArtifactCleanupFailed | Warning | Cleanup Job failed (finalizer blocks deletion until resolved) |
ArtifactCleanupSkipped | Warning | Referenced failover group or profile is gone |
Restore
| Reason | Type | Description |
|---|---|---|
RestoreStarted | Normal | Restore Job created |
RestoreSucceeded | Normal | Restore completed successfully |
RestoreFailed | Warning | Restore Job failed |
RestoreTargetUnavailable | Warning | Active site is not writable or not ready for restore |
RestoreBuildFailed | Warning | Failed to build restore Job spec |
Credentials and secrets
| Reason | Type | Description |
|---|---|---|
CredentialReconcileFailed | Warning | Failed to reconcile MySQL users |
SecretNotFound | Warning | Referenced Secret not found |
SecretMissingKey | Warning | Secret is missing a required key |
Lifecycle
| Reason | Type | Description |
|---|---|---|
GracefulShutdown | Normal | Graceful shutdown started or completed |
Forwarding events with Kubewatch
Kubewatch can watch for Kubernetes Events and forward them to Slack, PagerDuty, webhooks, and more. Example configuration to forward all Bloodraven events to Slack:
apiVersion: v1
kind: ConfigMap
metadata:
  name: kubewatch
data:
  .kubewatch.yaml: |
    handler:
      slack:
        channel: "#mysql-alerts"
    resource:
      event: true
    namespaces:
      - bloodraven
---
apiVersion: apps/v1
kind: Deployment
metadata:
  name: kubewatch
spec:
  template:
    spec:
      containers:
        - name: kubewatch
          env:
            - name: KW_SLACK_TOKEN
              valueFrom:
                secretKeyRef:
                  name: kubewatch-secrets
                  key: slack-token
Store credentials in a Kubernetes Secret, not in the ConfigMap. The KW_SLACK_TOKEN environment variable is read by Kubewatch at startup.
Argo Events and Event Router are alternatives that offer richer filtering and routing capabilities.
Status API
The operator serves a JSON status API on :8082.
GET /status
Returns the current state of all failover groups:
curl http://localhost:8082/status
{
  "default/orders": {
    "activeSite": "iad",
    "sites": [
      {
        "name": "iad",
        "state": "writable"
      },
      {
        "name": "pdx",
        "state": "read-only"
      }
    ],
    "pollTime": "2025-01-01T00:00:00Z"
  }
}
GET /active-site
Returns the active (writable) site for a specific failover group. Used by the sidecar's startup safety net.
curl "http://localhost:8082/active-site?namespace=default&group=orders"
{
  "namespace": "default",
  "group": "orders",
  "activeSite": "iad"
}
| Status | Meaning |
|---|---|
200 | Failover group found. activeSite may be "" if no single writable site exists (first boot, split-brain). |
400 | Missing namespace or group query parameter. |
404 | Failover group not found on this operator instance. |
503 | Operator has no active topology managers (startup race or non-leader replica). |
GET /ws/status
WebSocket endpoint that streams the full topology of each failover group in real time. A message is sent at the end of every operator poll cycle (default every 2s per group), not only on state transitions, so dashboards can render live counters and health indicators.
Each message is a JSON object with camelCase keys:
{
  "namespace": "default",
  "group": "orders",
  "activeSite": "iad",
  "sites": [
    {
      "name": "iad",
      "state": "writable",
      "lastSeen": "2026-04-10T00:00:00Z",
      "replicating": false
    },
    {
      "name": "pdx",
      "state": "read-only",
      "lastSeen": "2026-04-10T00:00:00Z",
      "replicating": true,
      "secondsBehindSource": 0,
      "gtidExecuted": "3e11fa47-71ca-11e1-9e33-c80aa9429562:1-45839"
    }
  ],
  "lastFailover": "2026-04-09T22:10:00Z",
  "lastFailoverTarget": "iad",
  "promotionGtidExecuted": "3e11fa47-71ca-11e1-9e33-c80aa9429562:1-45839",
  "pollTime": "2026-04-10T00:00:00Z"
}
When a site has divergent transactions after an emergency failover, the site entry includes recovery fields:
{
  "name": "pdx",
  "state": "read-only",
  "lastSeen": "2026-04-10T00:00:00Z",
  "replicating": false,
  "recoveryState": "RecoveryBlocked",
  "divergentGtid": "a1b2c3d4-0000-0000-0000-000000000000:11-15",
  "divergentTransactionCount": 5
}
const ws = new WebSocket("ws://localhost:8082/ws/status");
ws.onmessage = (event) => {
  const msg = JSON.parse(event.data);
  console.log(`${msg.group}: active=${msg.activeSite}`);
};
Both the REST and WebSocket endpoints use camelCase JSON keys, so the same field names work for either consumer.
Troubleshooting
Common conditions
| Symptom | Likely cause | Investigation |
|---|---|---|
Ready=False, Degraded=True | A site is unreachable or replication is broken | Check status.sites[].state and MySQL pod logs |
Ready=False, both sites read-only | No primary exists (may follow a failed failover) | See Operations: Manual promotion |
Ready=False, both sites writable | Split brain | See Operations: Split brain recovery |
RecoveryPending=True, reason RecoveryInProgress | Old primary is being reconfigured as a replica | Wait for the condition to clear. If it stays true, check operator logs and status.sites[].replicating. See Failover: Old primary recovery. |
RecoveryPending=True, reason DivergentTransactions | Old primary returned with divergent transactions | Check status.sites[].divergentGtid, then trigger a reclone: kubectl annotate mysqlfailovergroup <name> bloodraven.shipstream.io/reclone-site=<site>. See Failover: Old primary recovery. |
| Repeated failovers | Flapping network or unstable MySQL | Check bloodraven_state_transitions_total and consider increasing failureThreshold or failoverCooldown |
| High replication lag | Slow network, heavy write load, or undersized replica | Check bloodraven_replication_lag_seconds and MySQL performance metrics |
Operator logs
The operator logs structured JSON. Key fields to filter on:
kubectl logs -n bloodraven deploy/bloodraven | jq 'select(.msg == "failover")'
kubectl logs -n bloodraven deploy/bloodraven | jq 'select(.level == "ERROR")'
Sidecar logs
Check the sidecar container for self-fencing events:
IAD_POD=$(kubectl get pod -n orders \
  -l app.kubernetes.io/name=mysql,shipstream.io/failover-group=orders,shipstream.io/site=iad \
  -o jsonpath='{.items[0].metadata.name}')
kubectl logs -n orders "$IAD_POD" -c sidecar | jq 'select(.msg | contains("self-fence"))'