Grafana Dashboards
The Helm chart ships five dashboards in charts/bloodraven/dashboards/.
| Dashboard | Audience | Purpose |
|---|---|---|
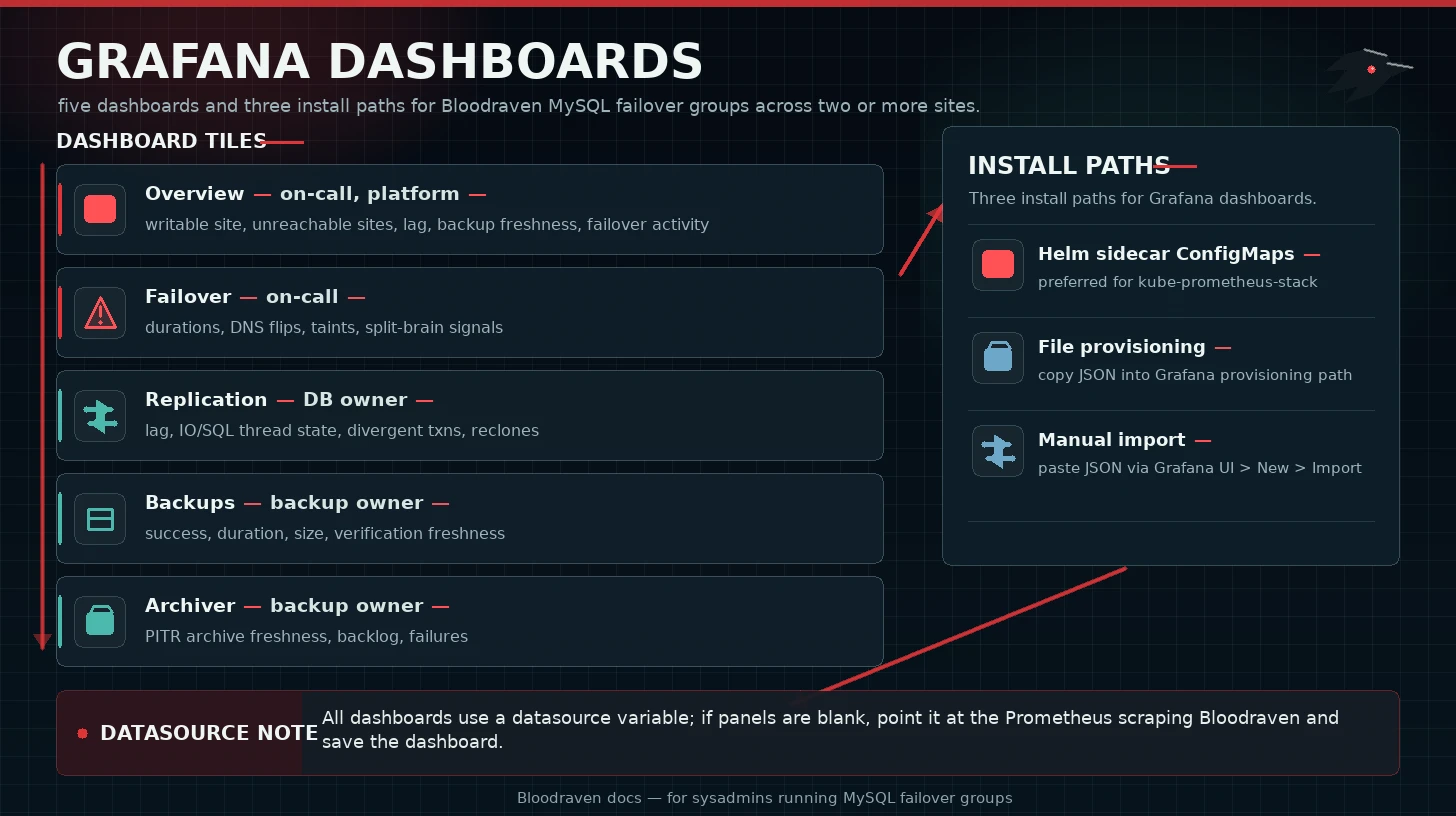
| Overview | On-call, platform | Writable site, unreachable sites, lag, backup freshness, failover activity |
| Failover | On-call | Failover durations, DNS flips, taints, split-brain signals |
| Replication | Database owner | Lag, IO/SQL thread state, divergent transactions, reclones |
| Backups | Backup owner | Backup success, duration, size, verification freshness |
| Archiver | Backup owner | PITR archive freshness, backlog, failures |
Helm sidecar ConfigMaps
Use this path when Grafana has a dashboard sidecar, as in kube-prometheus-stack.
grafanaDashboards:
  enabled: true
  namespace: monitoring
  label: grafana_dashboard
  labelValue: "1"
  folder: Bloodraven
helm upgrade --install bloodraven bloodraven/bloodraven \
  --namespace bloodraven \
  --values bloodraven-values.yaml
File provisioning
Copy charts/bloodraven/dashboards/*.json into Grafana's provisioning path and configure a provider:
apiVersion: 1
providers:
  - name: bloodraven
    folder: Bloodraven
    type: file
    allowUiUpdates: true
    options:
      path: /var/lib/grafana/dashboards/bloodraven
Manual import
In Grafana, open Dashboards > New > Import, paste each JSON file, and select the Prometheus datasource.
Datasource variable
All dashboards use a datasource variable. If panels show no data, open dashboard settings, confirm the variable points at the Prometheus datasource scraping Bloodraven, and save the dashboard.
Troubleshooting
| Symptom | Check |
|---|---|
| No data | Prometheus target up, datasource variable, time range |
| Wrong datasource | Dashboard variable default and folder provisioning |
| Sidecar did not import | ConfigMap namespace, grafana_dashboard label, sidecar namespace scope |
| Stale dashboards | ConfigMap updated, Grafana sidecar logs, dashboard uid stable |