Observability Overview
Bloodraven exposes operational state through Kubernetes status, Events, structured logs, Prometheus metrics, and Grafana dashboards.
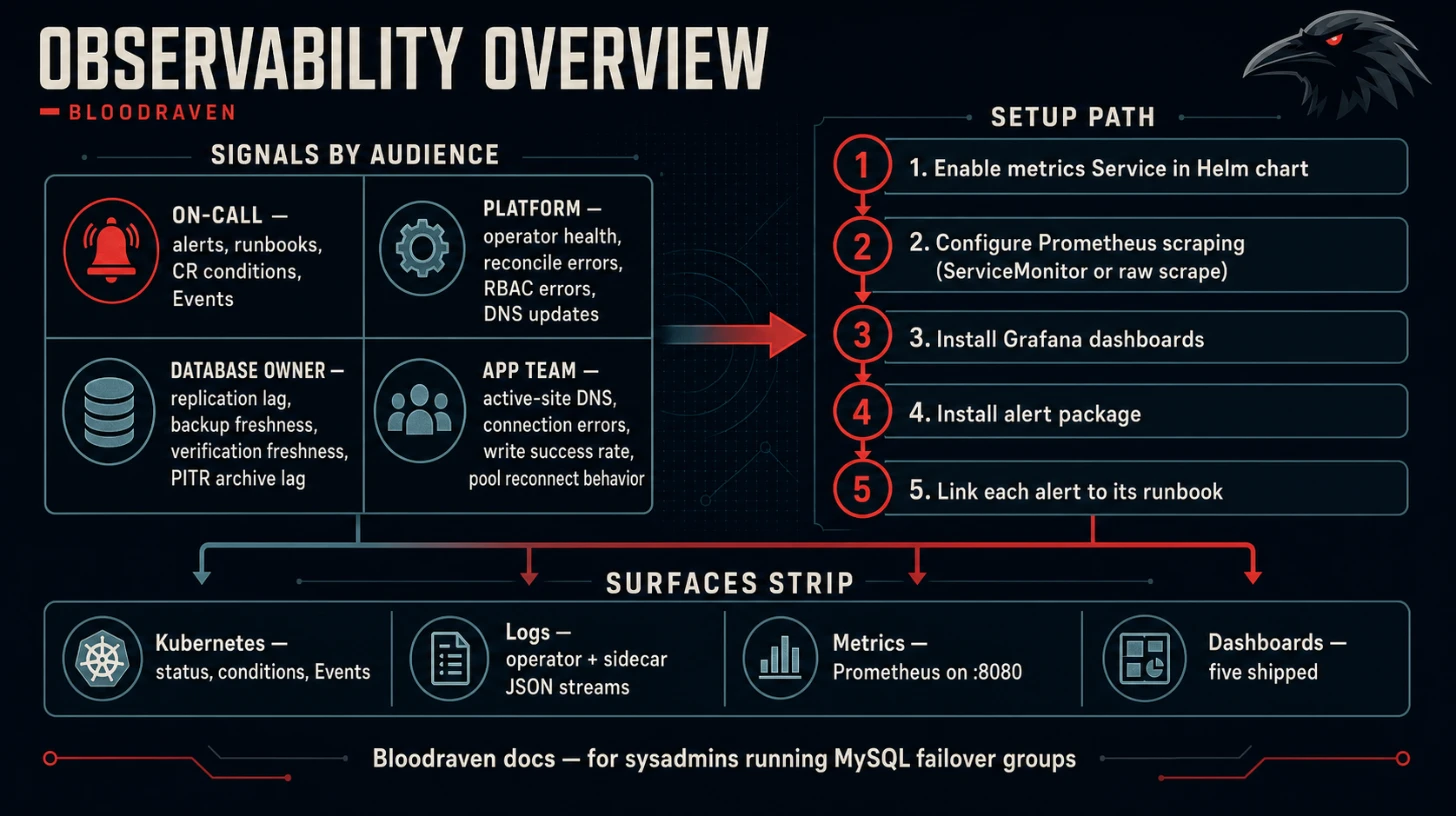
Signals by audience
| Audience | Primary signals |
|---|---|
| On-call | Alerts, runbooks, MysqlFailoverGroup conditions, Events |
| Platform | Operator health, reconcile errors, RBAC errors, DNS updates |
| Database owner | Replication lag, backup freshness, verification freshness, PITR archive lag |
| App team | Active-site DNS, connection errors, write success rate, pool reconnect behavior |
Setup path
- Enable the metrics Service in the Helm chart.
- Configure Prometheus scraping with a
ServiceMonitoror raw scrape config. - Install Grafana dashboards.
- Install the alert package used by your environment.
- Link each alert to Runbooks.
- Use the Observability Change Checklist for PRs or releases that change observability signals.